原文为Riyaj Shamsudeen https://orainternals.wordpress.com/2013/06/12/dude-where-is-my-redo/
本博文旨在讨论一个识别对象,包括较大量redo的方法。首先,我们设置重做大小急剧扩大,然后确定生成更多redo的对象。不幸的是,redo大小不在一段级别被跟踪。不过你可以使用‘db block changes’统计进行推测。但你必须使用LogMiner工具来科学识别生成更多redo的对象。
检测redo大小增加
可以访问AWR表(需要诊断许可证)来确定redo大小增加。下面的查询spool redo大小增加。你只要打开Excel电子表格中的输出文件redosize.lst并图形化数据观察redo大小的变化。在Excel表格中打开文件时,使用管道符号作为分隔符。
spool redosize.lst
REM  You need Diagnostic Pack licence to execute this query!
REM  Author: Riyaj Shamsudeen
col begin_interval_time format a30
set lines 160 pages 1000
col end_interval_time format a30
set colsep '|'
alter session set nls_date_format='DD-MON-YYYY';
with redo_sz as (
SELECT  sysst.snap_id, sysst.instance_number, begin_interval_time ,end_interval_time ,  startup_time,
VALUE - lag (VALUE) OVER ( PARTITION BY  startup_time, sysst.instance_number
                ORDER BY begin_interval_time, startup_time, sysst.instance_number) stat_value,
EXTRACT (DAY    FROM (end_interval_time-begin_interval_time))*24*60*60+
            EXTRACT (HOUR   FROM (end_interval_time-begin_interval_time))*60*60+
            EXTRACT (MINUTE FROM (end_interval_time-begin_interval_time))*60+
            EXTRACT (SECOND FROM (end_interval_time-begin_interval_time)) DELTA
  FROM sys.wrh$_sysstat sysst , DBA_HIST_SNAPSHOT snaps
WHERE (sysst.dbid, sysst.stat_id) IN ( SELECT dbid, stat_id FROM sys.wrh$_stat_name WHERE  stat_name='redo size' )
AND snaps.snap_id = sysst.snap_id
AND snaps.dbid =sysst.dbid
AND sysst.instance_number=snaps.instance_number
and begin_interval_time > sysdate-90
)
select instance_number,
  to_date(to_char(begin_interval_time,'DD-MON-YYYY'),'DD-MON-YYYY') dt
, sum(stat_value) redo1
from redo_sz
group by  instance_number,
  to_date(to_char(begin_interval_time,'DD-MON-YYYY'),'DD-MON-YYYY')
order by instance_number, 2
/
spool off
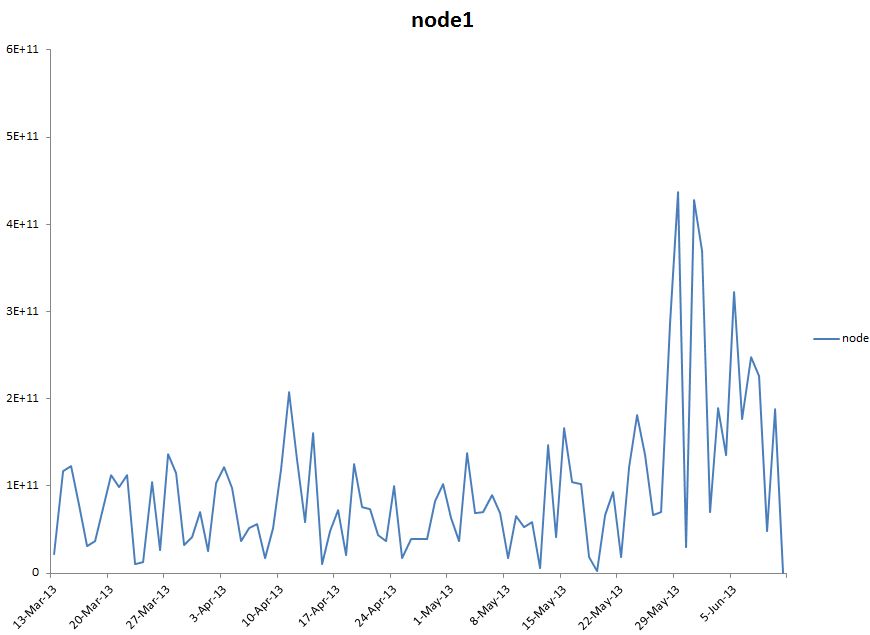
可视化数据将帮助你快速识别redo生成中的任何模式异常。下面是从Excel电子表格创建的示例图,看到最近增加的redo大小。
使用‘db block changes’统计推测对象
猜测产生较高redo大小的对象的一个快速方法是使用db block changes的统计数据。这种技术背后的原理是,如果对象被大量修改,则该对象可能会产生更多的redo。但这并不是一个完全准确的说法,因为修改频率较少的对象可以产生更多的redo,反之亦然。如果你很幸运,一个或两个有问题的对象会凸显,你可以进一步查看这些段,以减少redo大小。
@segment_stats.sql
To show all segment level statistics in one screen

Enter value for statistic_name: db block changes
old   6:           where value >0  and statistic_name like '%'||'&&statistic_name' ||'%'
new   6:           where value >0  and statistic_name like '%'||'db block changes' ||'%'
   INST_ID STATISTIC_NAME                 OWNER        OBJECT_NAME        OBJECT_TYP        VALUE   PERC
---------- ------------------------------ ------------ ----------------- ---------- ------------ ------
         1 db block changes               INV          SALES_TEMP_N1     INDEX        3831599856  48.66
         3                                INV          MTL_RESERV        TABLE        3794818912  23.78
         3                                ZX           DET_FACTORS_      INDEX        2468120576  15.47
         2                                APPLSYS      FND_TAB           TABLE        2346839248  16.33
….
Segment_stats.sql脚本可以在segment_stats中找到。
使用LogMiner确定对象
识别生成较高redo的对象的科学方法是使用日志挖掘包。可以通过以下步骤来识别对象:
第1步:从SQL * Plus中的SYS或SYSTEM用户启动LogMiner。这里给出的例子是对于finprod2实例归档日志文件。
begin sys.dbms_logmnr.ADD_LOGFILE ('/opt/app/prod/finprod2/arch/finprod_212_2_1212121221.arch');end;/begin sys.dbms_logmnr.START_LOGMNR;end;/
第2步:从V $ logmnr_contents动态性能视图查询数据来创建一个表。我倾向于对每个归档日志文件创建单独的表,原因有二:(1)提高查询性能(2)我还没有用多个归档日志文件进行全面测试。下面的SQL语句通过从下一条记录的RBA(重做字节地址)减去当前记录的RBA找出重做记录的长度。重做字节地址提供一个重做日志文件中重做记录的物理位置。使用当前重做记录和下一个重做记录的物理位置,我们可以找出当前重做记录的长度。
更新1: Greg在评论中指出,我对脚本中的重做块大小使用硬编码512个字节,这在Solaris和Linux平台上是正确的。但是,在HP平台,重做块的大小是1024字节。你可以使用下面的SQL语句来识别重做块大小。我已经修改了create table脚本来动态查询重做块大小。

SQL>select max(lebsz) from x$kccle;
MAX(LEBSZ)
----------
 512
drop table redo_analysis_212_2;
CREATE TABLE redo_analysis_212_2 nologging AS
SELECT data_obj#, oper,
 rbablk * le.bsz + rbabyte curpos,
 lead(rbablk*le.bsz+rbabyte,1,0) over (order by rbasqn, rbablk, rbabyte) nextpos
FROM
 ( SELECT DISTINCT data_obj#, operation oper, rbasqn, rbablk, rbabyte
 FROM v$logmnr_contents
 ORDER BY rbasqn, rbablk, rbabyte
 ) ,
 (SELECT MAX(lebsz) bsz FROM x$kccle ) le
/

第3步:查询表以确定对object_name:在这一步中,我们连接了创建的表和obj$表,以确定引起重做大小变化的对象。外连接是必要的,因为对象可能最近已被drop。 START表示一个事务开始的重做记录,COMMIT表示一个事务结束的重做记录。

set lines 120 pages 40
column data_obj# format 9999999999
column oper format A15
column object_name format A60
column total_redo format 99999999999999
compute sum label 'Total Redo size' of total_Redo on report
break on report
spool /tmp/redo_212_2.lst
select data_obj#, oper, obj_name, sum(redosize) total_redo
from
(
select data_obj#, oper, obj.name obj_name , nextpos-curpos-1 redosize
from redo_analysis_212_2 redo1, sys.obj$ obj
where (redo1.data_obj# = obj.obj# (+) )
and nextpos !=0 -- For the boundary condition
and redo1.data_obj#!=0
union all
select data_obj#, oper, 'internal ' , nextpos-curpos redosize
from redo_analysis_212_2 redo1
where redo1.data_obj#=0 and redo1.data_obj# = 0
and nextpos!=0
)
group by data_obj#, oper, obj_name
order by 4
/
...
 46346 INSERT WSH_EXCEPTIONS 87006083
 12466144 INTERNAL MSII_N9 95800577
 12427363 INTERNAL MSII_N1 96445137
 0 START internal 125165844
 0 COMMIT internal 205600756
 12960642 UPDATE XLA_GLT_1234567890 243625297
 ---------------
Total Redo 3681252096
spool off

注意使用 log miner工具识别的对象与 db block changes统计的对象不匹配。在本例中,差异可能是因为,我从实例开始查看的段统计可能是不准确的。

总之,log miner工具可用于识别生成较高redo的对象。这将帮助你理解为什redo生成较高,也可能给你一个减少redo的机制。
This blog entry is to discuss a method to identify the objects inducing higher amount of redo. First,we will establish that redo size increased sharply and then identify the objects generating more redo. Unfortunately, redo size is not tracked at a segment level. However, you can make an educated guess using ‘db block changes’ statistics. But, you must use logminer utility to identify the objects generating more redo scientifically.
Detecting redo size increase
AWR tables (require Diagnostics license) can be accessed to identify the redo size increase. Following query spools the daily rate of redo size. You can easily open the output file redosize.lst in an Excel spreadsheet and graph the data to visualize the redo size change. Use pipe symbol as the delimiter while opening the file in excel spreadsheet.
spool redosize.lst
REM  You need Diagnostic Pack licence to execute this query!
REM  Author: Riyaj Shamsudeen
col begin_interval_time format a30
set lines 160 pages 1000
col end_interval_time format a30
set colsep '|'
alter session set nls_date_format='DD-MON-YYYY';
with redo_sz as (
SELECT  sysst.snap_id, sysst.instance_number, begin_interval_time ,end_interval_time ,  startup_time,
VALUE - lag (VALUE) OVER ( PARTITION BY  startup_time, sysst.instance_number
                ORDER BY begin_interval_time, startup_time, sysst.instance_number) stat_value,
EXTRACT (DAY    FROM (end_interval_time-begin_interval_time))*24*60*60+
            EXTRACT (HOUR   FROM (end_interval_time-begin_interval_time))*60*60+
            EXTRACT (MINUTE FROM (end_interval_time-begin_interval_time))*60+
            EXTRACT (SECOND FROM (end_interval_time-begin_interval_time)) DELTA
  FROM sys.wrh$_sysstat sysst , DBA_HIST_SNAPSHOT snaps
WHERE (sysst.dbid, sysst.stat_id) IN ( SELECT dbid, stat_id FROM sys.wrh$_stat_name WHERE  stat_name='redo size' )
AND snaps.snap_id = sysst.snap_id
AND snaps.dbid =sysst.dbid
AND sysst.instance_number=snaps.instance_number
and begin_interval_time > sysdate-90
)
select instance_number,
  to_date(to_char(begin_interval_time,'DD-MON-YYYY'),'DD-MON-YYYY') dt
, sum(stat_value) redo1
from redo_sz
group by  instance_number,
  to_date(to_char(begin_interval_time,'DD-MON-YYYY'),'DD-MON-YYYY')
order by instance_number, 2
/
spool off
Visualizing the data will help you to quickly identify any pattern anomalies in redo generation. Here is an example graph created from the excel spreadsheet and see that redo size increased recently.
Guess the object using ‘db block changes’ statistics
A quick method to guess the objects generating higher redo size is to use ‘db block changes’ statistics. The philosophy behind this technique is that, if the object is modified heavily then that object will probably generate more redo. But, it is not an entirely accurate statement as less frequently modified objects can generate more redo and vice versa. If you are lucky, one or two objects will stand out as a problem and you can review those segments further to reduce redo size.
@segment_stats.sql
To show all segment level statistics in one screen

Enter value for statistic_name: db block changes
old   6:           where value >0  and statistic_name like '%'||'&&statistic_name' ||'%'
new   6:           where value >0  and statistic_name like '%'||'db block changes' ||'%'
   INST_ID STATISTIC_NAME                 OWNER        OBJECT_NAME        OBJECT_TYP        VALUE   PERC
---------- ------------------------------ ------------ ----------------- ---------- ------------ ------
         1 db block changes               INV          SALES_TEMP_N1     INDEX        3831599856  48.66
         3                                INV          MTL_RESERV        TABLE        3794818912  23.78
         3                                ZX           DET_FACTORS_      INDEX        2468120576  15.47
         2                                APPLSYS      FND_TAB           TABLE        2346839248  16.33
….
Segment_stats.sql script can be found in segment_stats.
Identify objects using logminer
Scientific method to identify the object generating higher redo uses log mining package. Objects can be identified by the following steps:
Step 1: Start log miner from sys or system user in SQL*Plus. Example given here is for finprod2 instance archivelog file.
begin
  sys.dbms_logmnr.ADD_LOGFILE ('/opt/app/prod/finprod2/arch/finprod_212_2_1212121221.arch');
end;
/
begin
  sys.dbms_logmnr.START_LOGMNR;
end;
/
Step 2: Create a table by querying the data from v$logmnr_contents dynamic performance view. I tend to create a separate table for each archive log file for two reasons: (a) to improve the query performance (b)I haven’t tested thoroughly with multiple archivelog files. Following SQL statement finds the length of redo record by subtracting the RBA (Redo Byte Address) of the current record from the RBA of next record. Redo byte address provides the physical location of a redo record in a redo log file. Using the physical location of current redo record and the next redo record, we can find the length of current redo record.
Update 1: As Greg pointed out in comments section, I was using hard-coded 512 bytes for redo block size in my script, which is true in Solaris and Linux platform. But, in HP platform, redo block size is 1024 bytes. You can use the following SQL statement to identify the redo block size. I have modified the create table script to query redo block size dynamically.
SQL>select max(lebsz) from x$kccle;
MAX(LEBSZ)
----------
       512
drop table redo_analysis_212_2;
CREATE TABLE redo_analysis_212_2 nologging AS
SELECT data_obj#, oper,
  rbablk * le.bsz + rbabyte curpos,
  lead(rbablk*le.bsz+rbabyte,1,0) over (order by rbasqn, rbablk, rbabyte) nextpos
FROM
  ( SELECT DISTINCT data_obj#, operation oper, rbasqn, rbablk, rbabyte
  FROM v$logmnr_contents
  ORDER BY rbasqn, rbablk, rbabyte
  ) ,
  (SELECT MAX(lebsz) bsz FROM x$kccle ) le
/
Step 3: Query the table to identify the object_name: In this step, we join the table created and obj$ table to identify the objects inducing redo size. Outer join is needed as the object may have been dropped recently. START indicates the redo record for the start of a transaction and COMMIT indicates the redo record for the end of a transaction.
set lines 120 pages 40
column data_obj# format  9999999999
column oper format A15
column object_name format A60
column total_redo format 99999999999999
compute sum label 'Total Redo size' of total_Redo on report
break on report
spool /tmp/redo_212_2.lst
select data_obj#, oper, obj_name, sum(redosize) total_redo
from
(
select data_obj#, oper, obj.name obj_name , nextpos-curpos-1 redosize
from redo_analysis_212_2 redo1, sys.obj$ obj
where (redo1.data_obj# = obj.obj# (+) )
and  nextpos !=0 -- For the boundary condition
and redo1.data_obj#!=0
union all
select data_obj#, oper, 'internal ' , nextpos-curpos  redosize
from redo_analysis_212_2 redo1
where  redo1.data_obj#=0 and  redo1.data_obj# = 0
and nextpos!=0
)
group by data_obj#, oper, obj_name
order by 4
/
...
      46346 INSERT          WSH_EXCEPTIONS                        87006083
   12466144 INTERNAL        MSII_N9                               95800577
   12427363 INTERNAL        MSII_N1                               96445137
          0 START           internal                             125165844
          0 COMMIT          internal                             205600756
   12960642 UPDATE          XLA_GLT_1234567890                   243625297
                                                           ---------------
Total Redo                                                      3681252096
spool off
Notice that objects identified using log miner tool is not matching with the objects from db block changes statistics. In this example, the discrepancy is probably because, I am looking at segment stats from the start of instance which may not be accurate.
In summary, log miner utility can be used to identify the objects generating higher redo. This will help you to understand why the redo generation is higher and may be, gives you a mechanism to reduce redo.
Leave a Reply